stevek
1
Generated: 2026-01-24 20:10:50
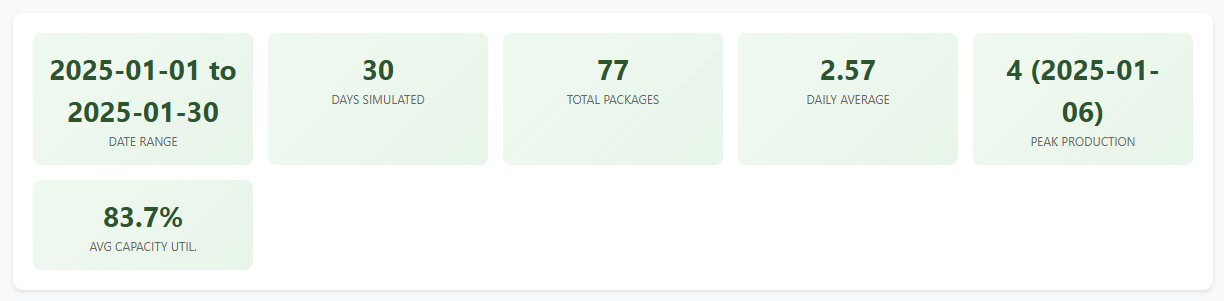
1. Executive Summary
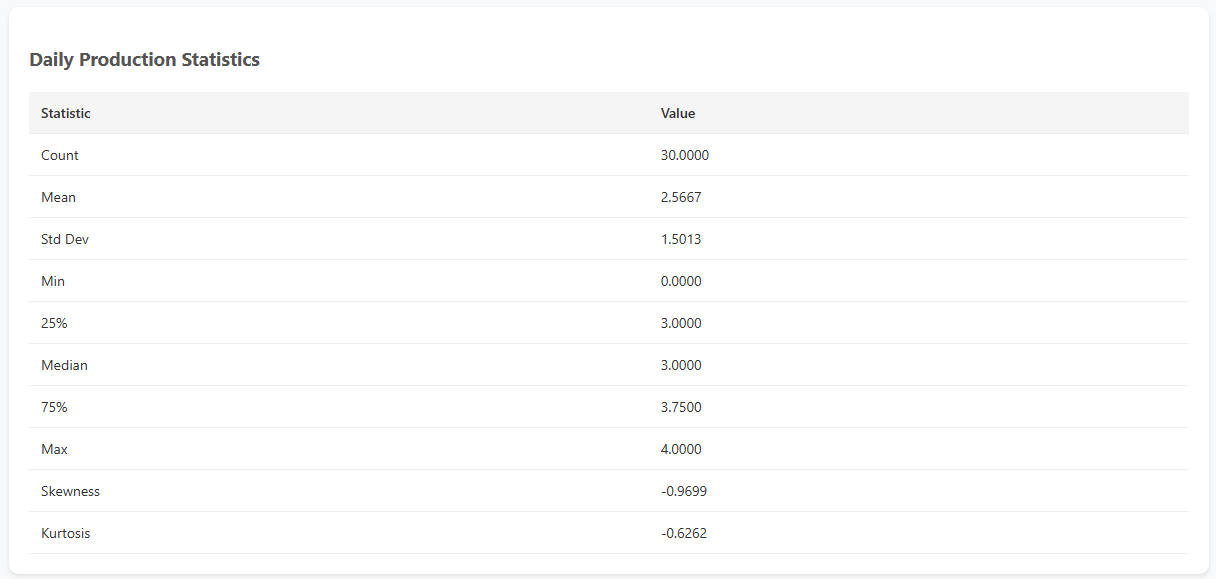
2. Descriptive Statistics
Daily Production Statistics
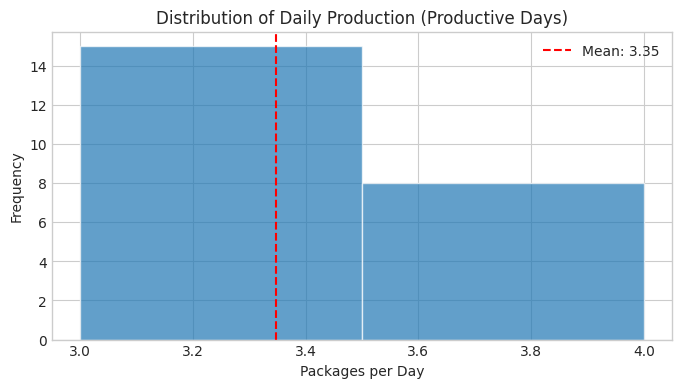
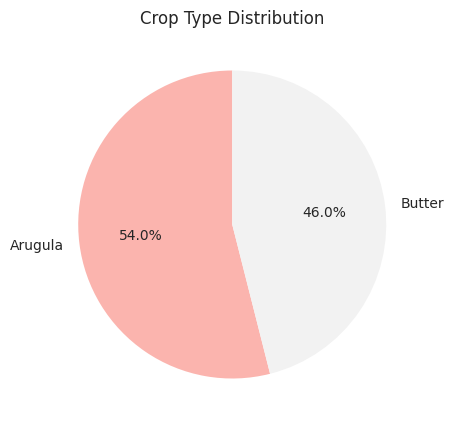
Production Distribution
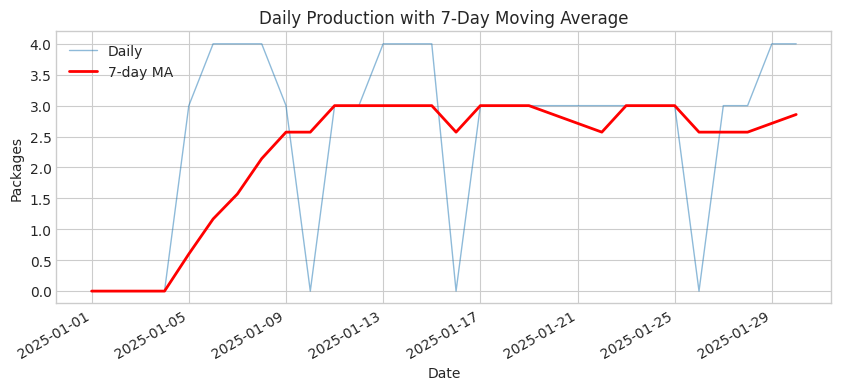
3. Time Series Analysis
Production Trend
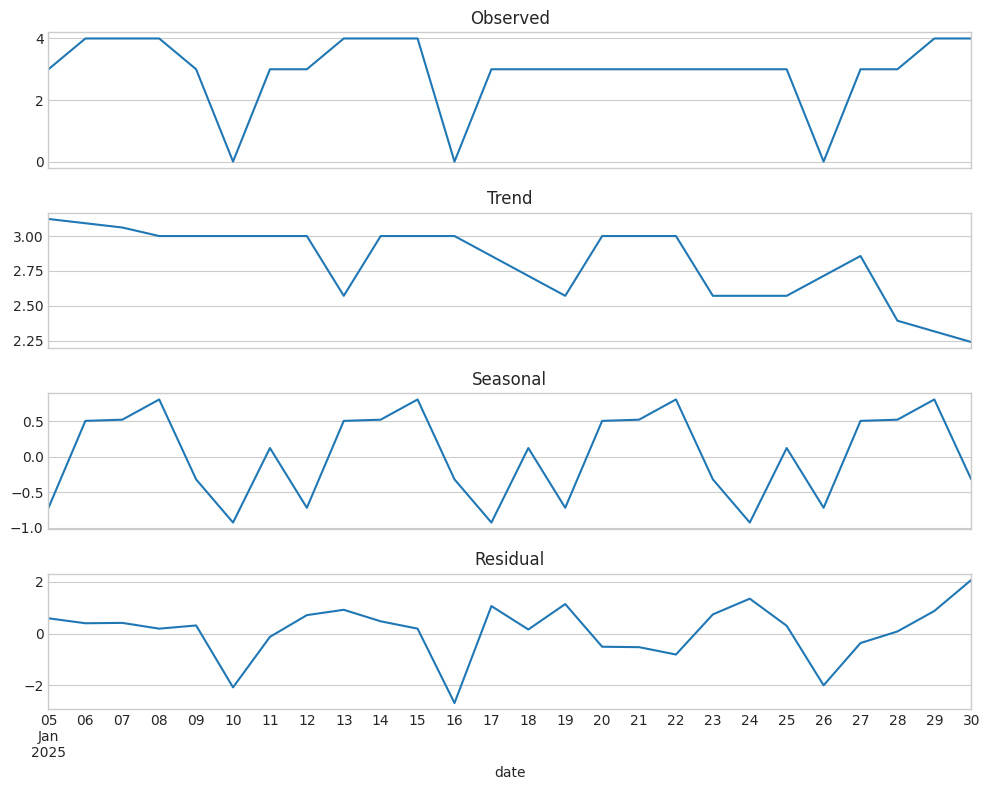
Seasonal Decomposition
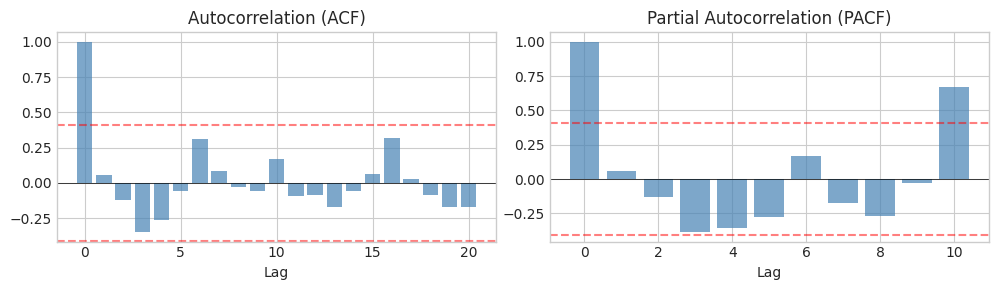
Autocorrelation Analysis
Stationarity Test (Augmented Dickey-Fuller)
| Metric |
Value |
| ADF Statistic |
-0.3481 |
| P-Value |
0.9184 |
| Conclusion |
Non-stationary (fail to reject H0) |
4. Crop Analytics
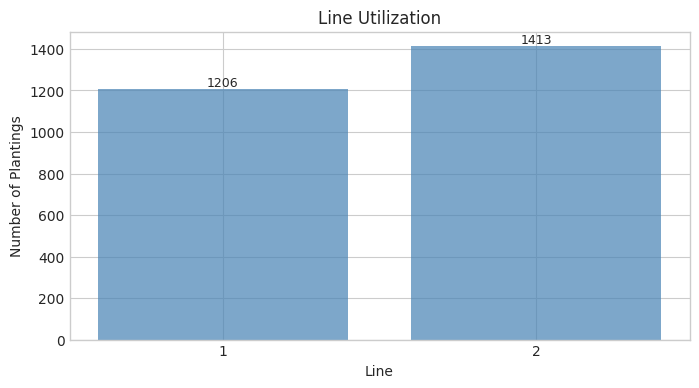
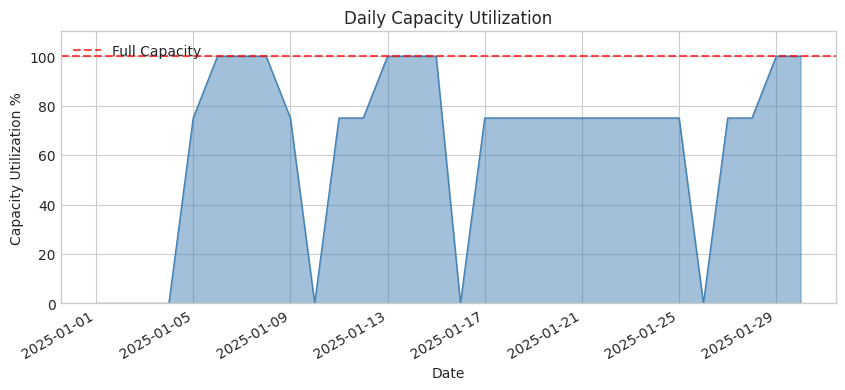
Line Utilization
Days to Harvest (Maturity)
| Statistic |
Days |
| count |
2619.0 |
| mean |
4.5 |
| std |
0.5 |
| min |
4.0 |
| 25% |
4.0 |
| 50% |
4.0 |
| 75% |
5.0 |
| max |
5.0 |
5. Capacity Analysis
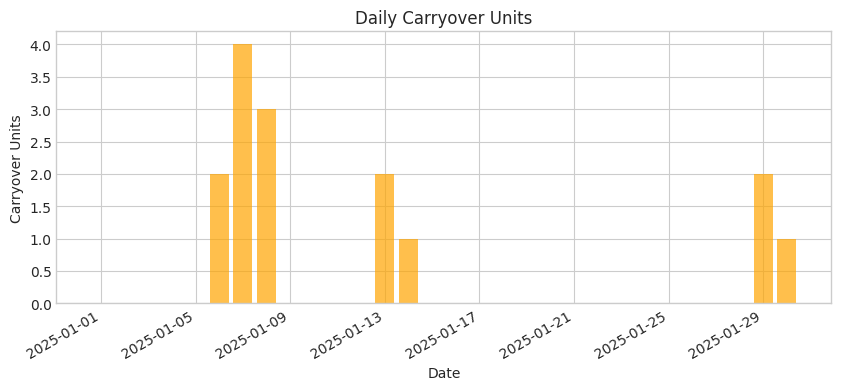
Carryover Analysis

Carryover Pattern
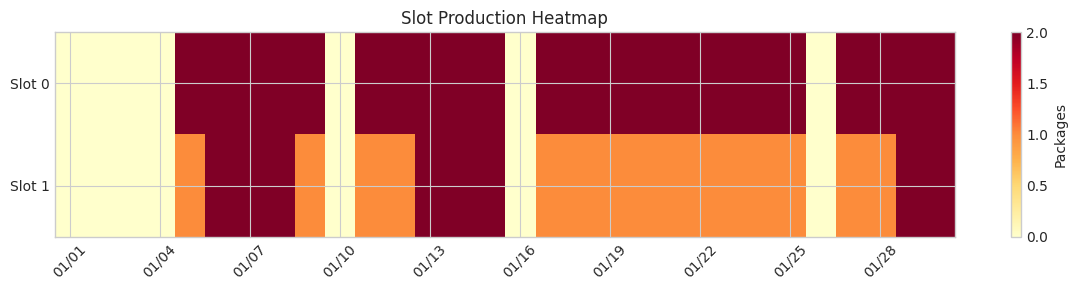
Slot Production Heatmap
Slot Summary
| Slot |
Total Packages |
Avg/Day |
Max/Day |
Total Remaining |
| Slot 0 |
46 |
1.53 |
2 |
46 |
| Slot 1 |
31 |
1.03 |
2 |
15 |
6. Statistical Tests
Normality Test (Shapiro-Wilk)
| Metric |
Value |
| W Statistic |
0.6054 |
| P-Value |
0.0000 |
| Conclusion |
Not normal (reject H0) |
One-Sample T-Test (Mean vs Capacity = 4)
| Metric |
Value |
| T Statistic |
-6.4226 |
| P-Value |
0.0000 |
| Conclusion |
Mean significantly differs from capacity |
95% Confidence Interval for Mean Daily Production
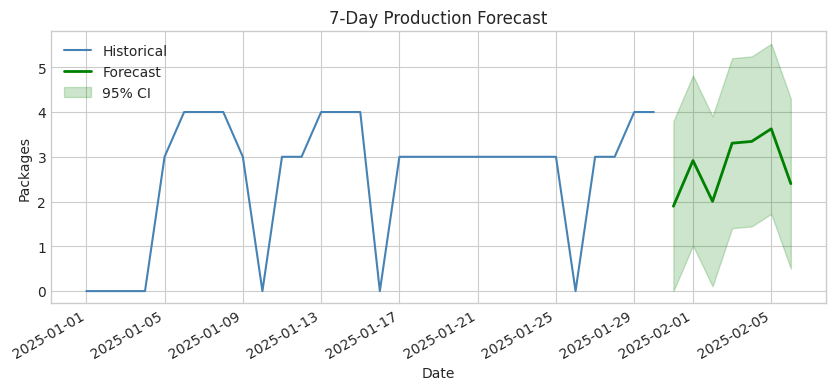
7. Production Forecast
7-Day Forecast (Exponential Smoothing)
| Date |
Forecast |
Lower 95% |
Upper 95% |
| 2025-01-31 |
1.90 |
0.00 |
3.79 |
| 2025-02-01 |
2.92 |
1.02 |
4.82 |
| 2025-02-02 |
2.01 |
0.11 |
3.90 |
| 2025-02-03 |
3.30 |
1.41 |
5.20 |
| 2025-02-04 |
3.34 |
1.44 |
5.24 |
| 2025-02-05 |
3.62 |
1.73 |
5.52 |
| 2025-02-06 |
2.40 |
0.50 |
4.30 |
CEA Twin Analytics Report | Generated by analytics.py